Total visibility.
Zero blind spots.
See exactly what's happening across your SQL Server and Azure SQL environments, in real time.
How it works
Deploy once. Monitor everything in minutes.
Deploy once, collect from all your SQL Servers. Just your data - readable and inspectable.
01
Connect to SQL Server
Point SQLWATCH Cloud Collector at your SQL Servers. Reads system data, not user data. Few minutes setup.
02
Collect
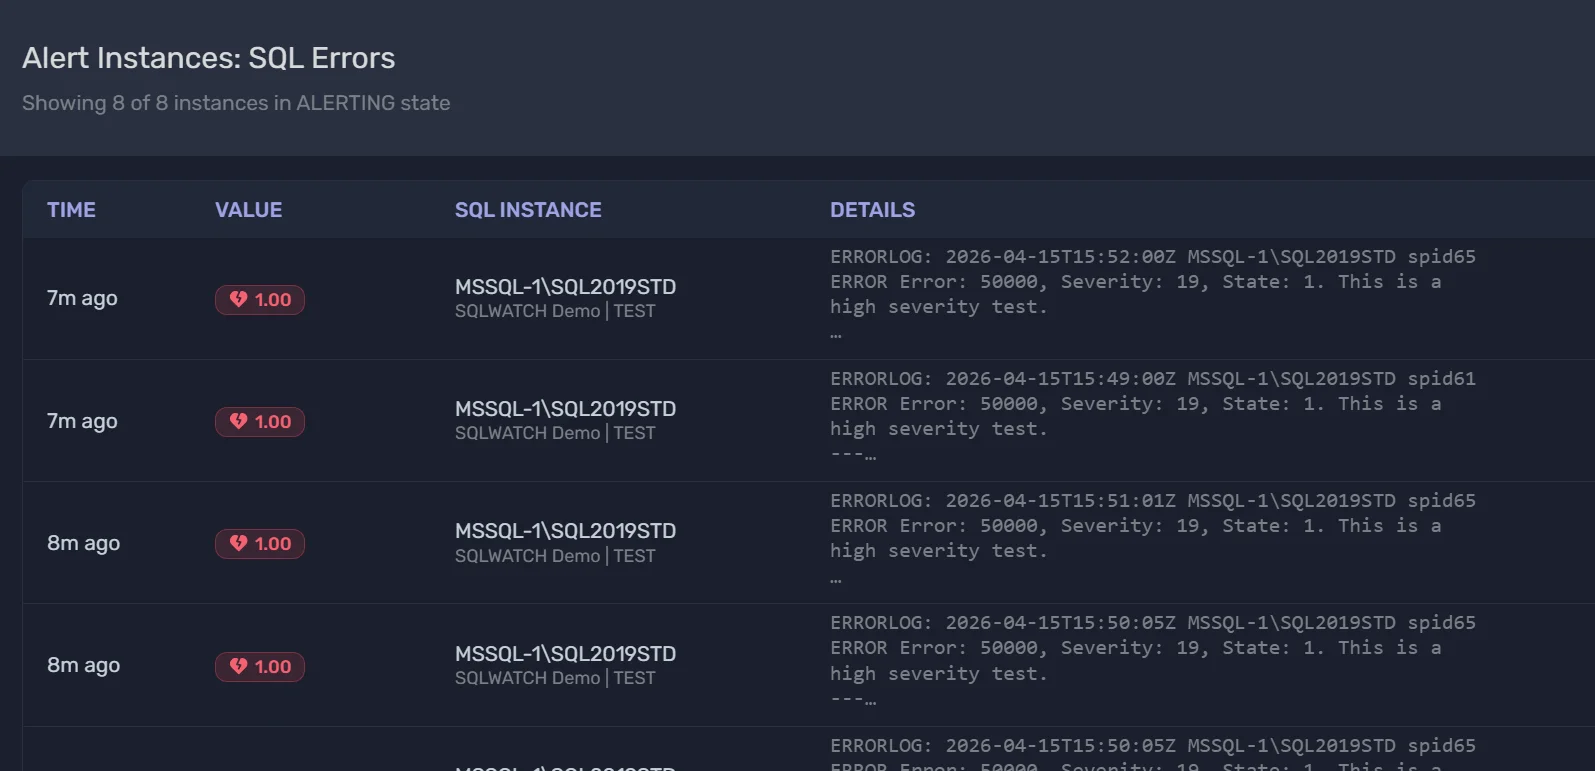
24/7 data collection that gathers all critical performance metrics, error logs, agent jobs and everything DBAs need.
03
See in SQLWATCH Cloud
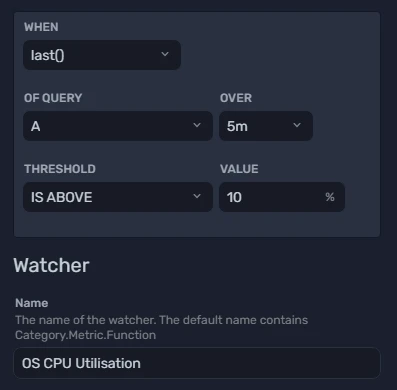
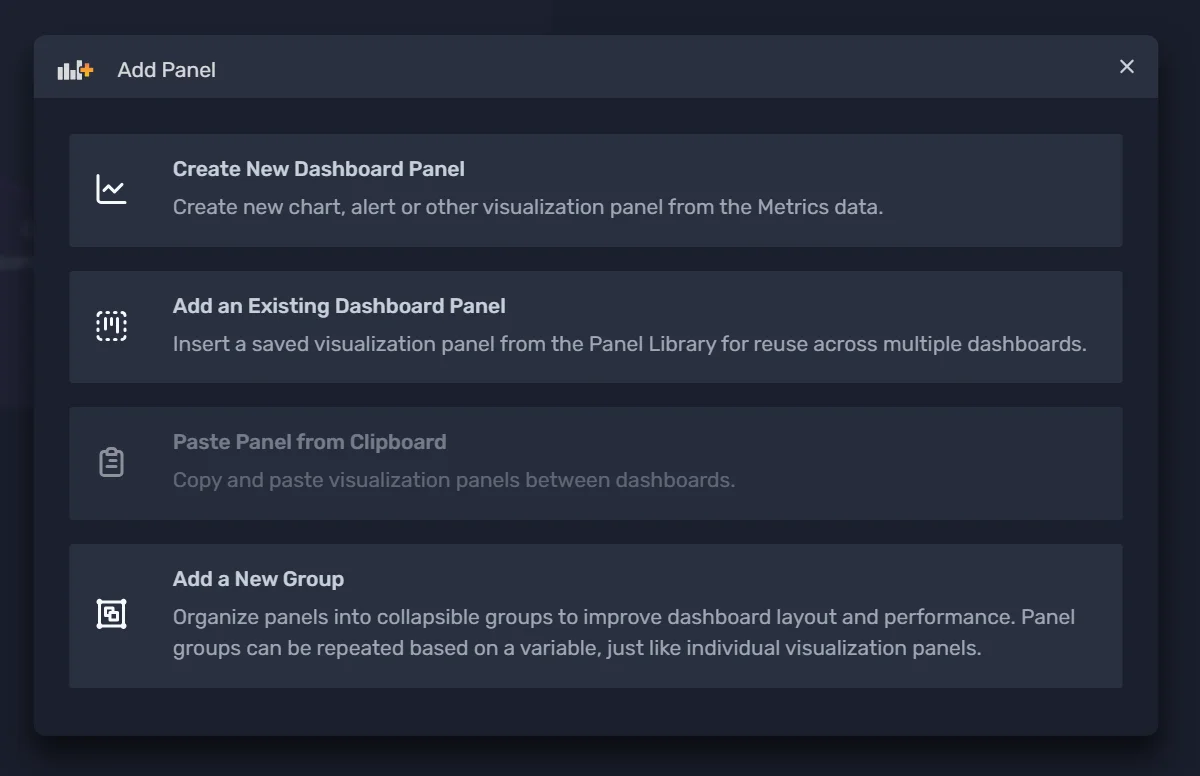
Pre-configured dashboards and alerts. Customisable thresholds + build your own because monitoring is personal.
MSP
Built for how MSPs actually work
Business
Designed around the DBA workflow

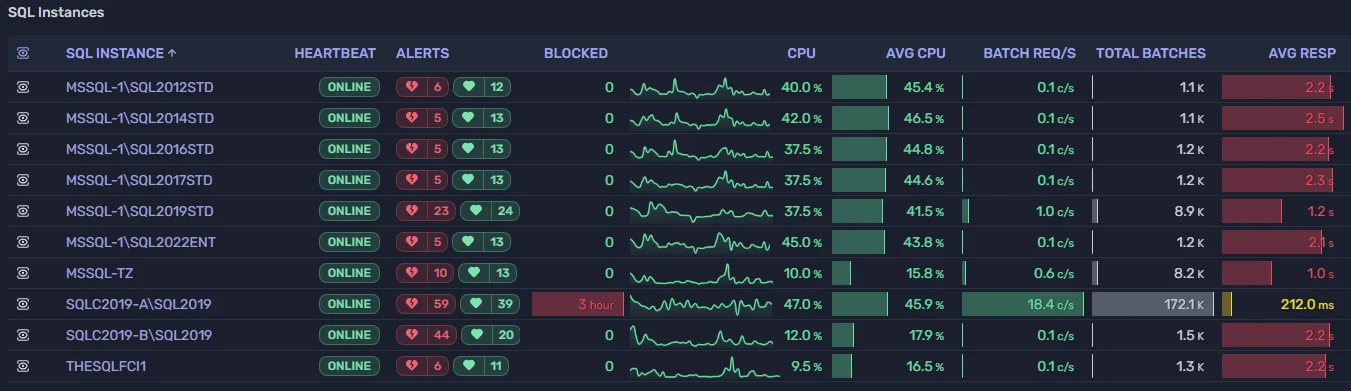
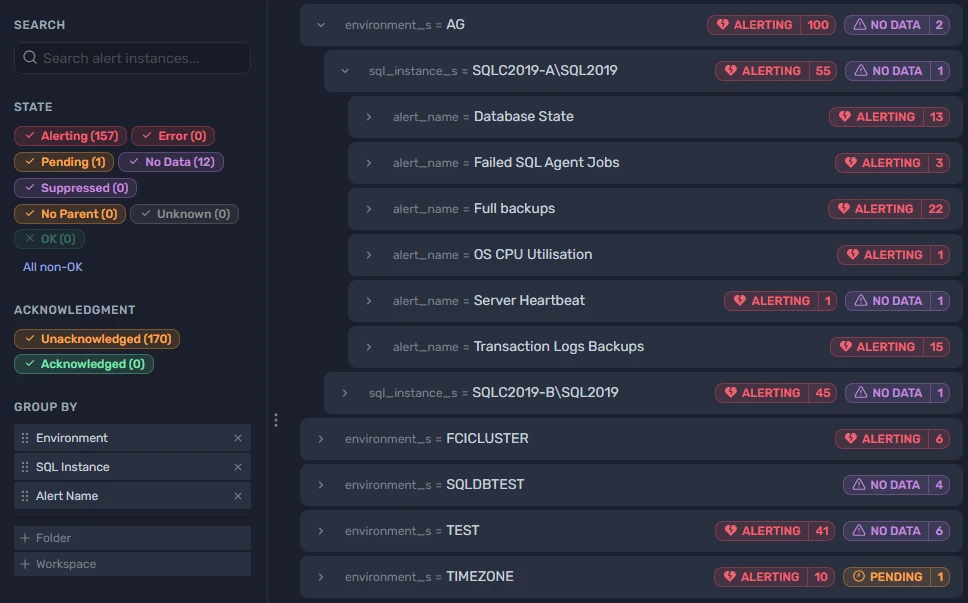
Single pane of glass
See every client environment from your MSP dashboard. Spot issues across your entire portfolio at a glance.
Isolated client workspaces
Each client gets their own private workspace. They see only their data - never yours or another client's.
Flexible scaling
Add or remove instances monthly as your client base grows. No tiers, no complexity, no surprises.
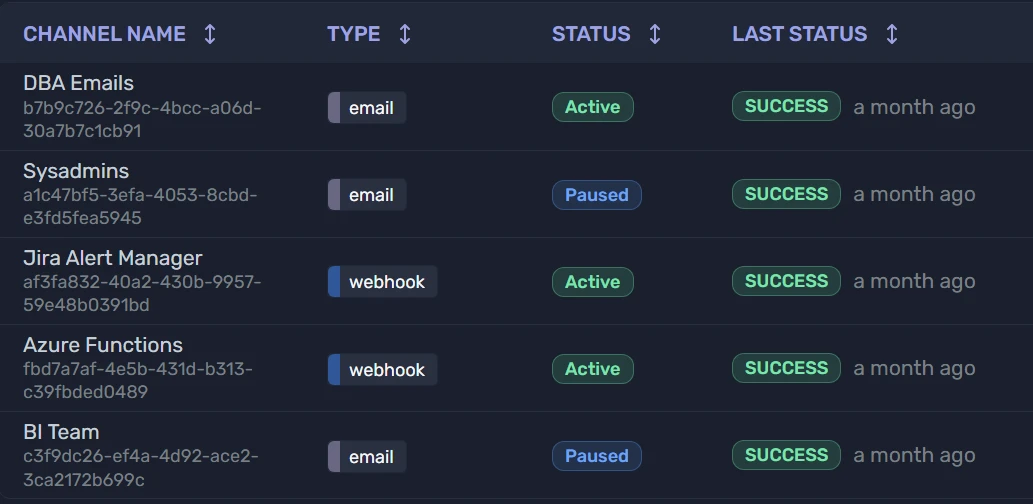
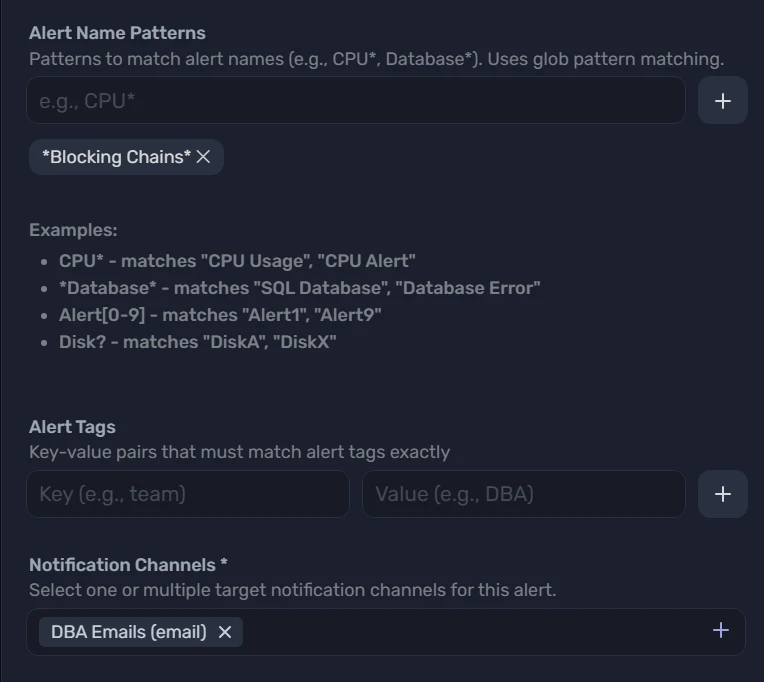
Custom alerts per client
Configure independent alert thresholds, Slack, Teams, and webhook integrations for each client workspace.
Data sovereignty
Client data is hosted in your chosen region. Meet compliance requirements and data residency obligations.
Co-marketing opportunities
Joint marketing, partner listings, and co-branded materials to help you grow your managed SQL Server practice.
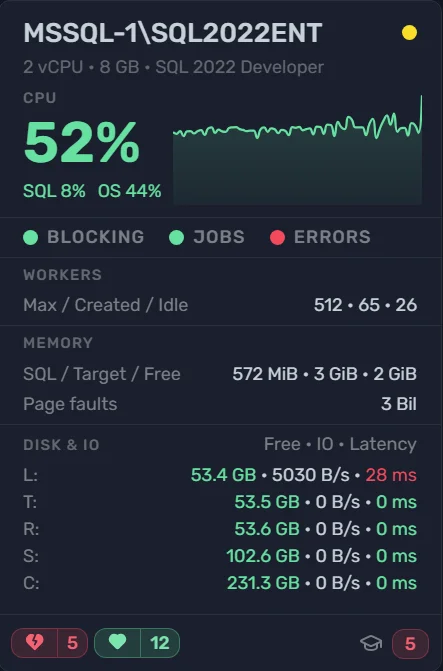
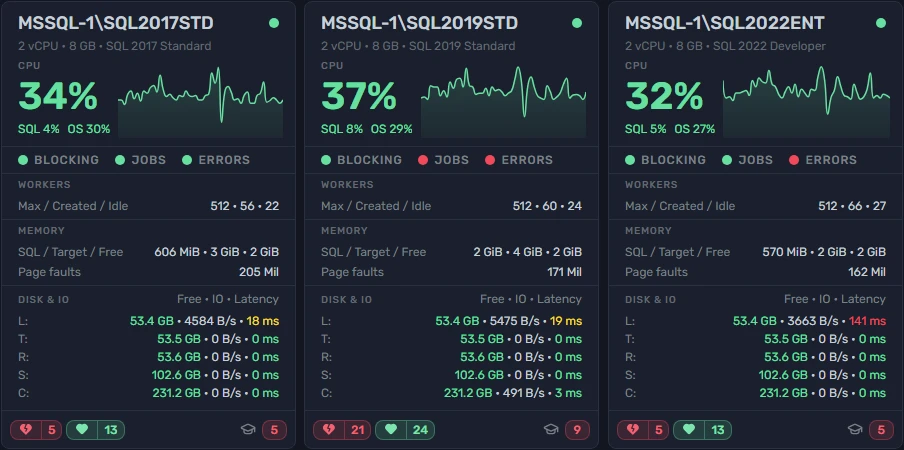
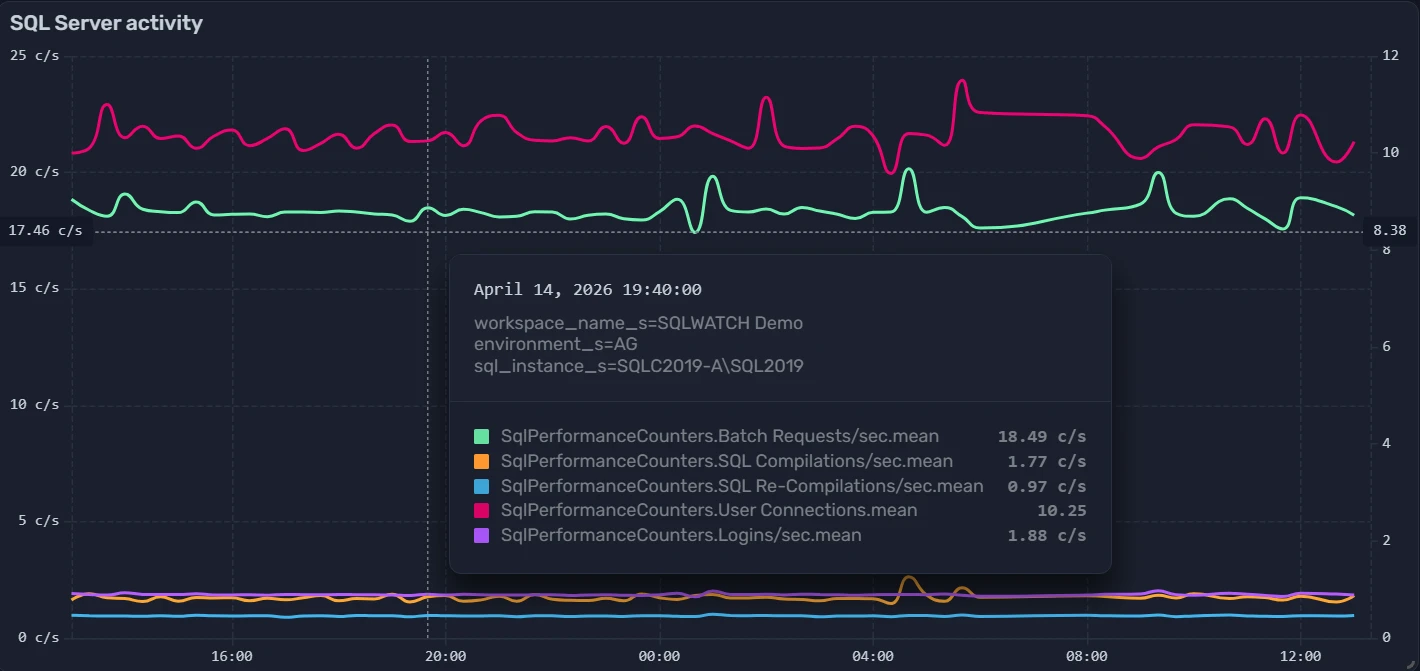
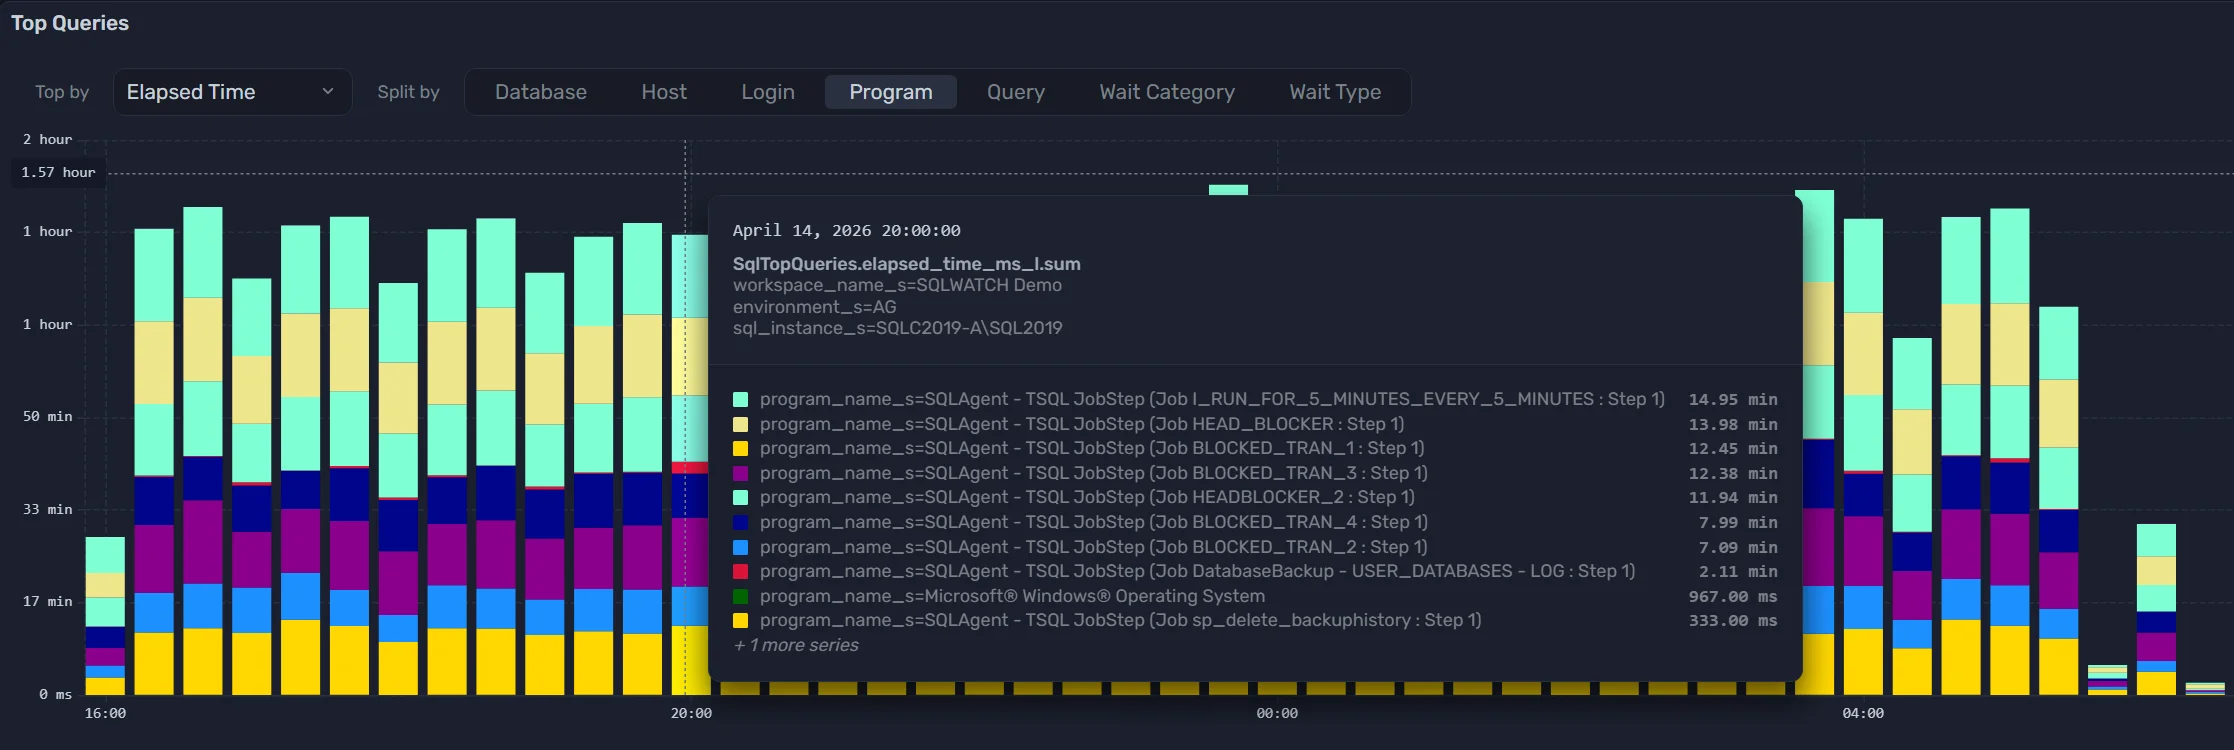
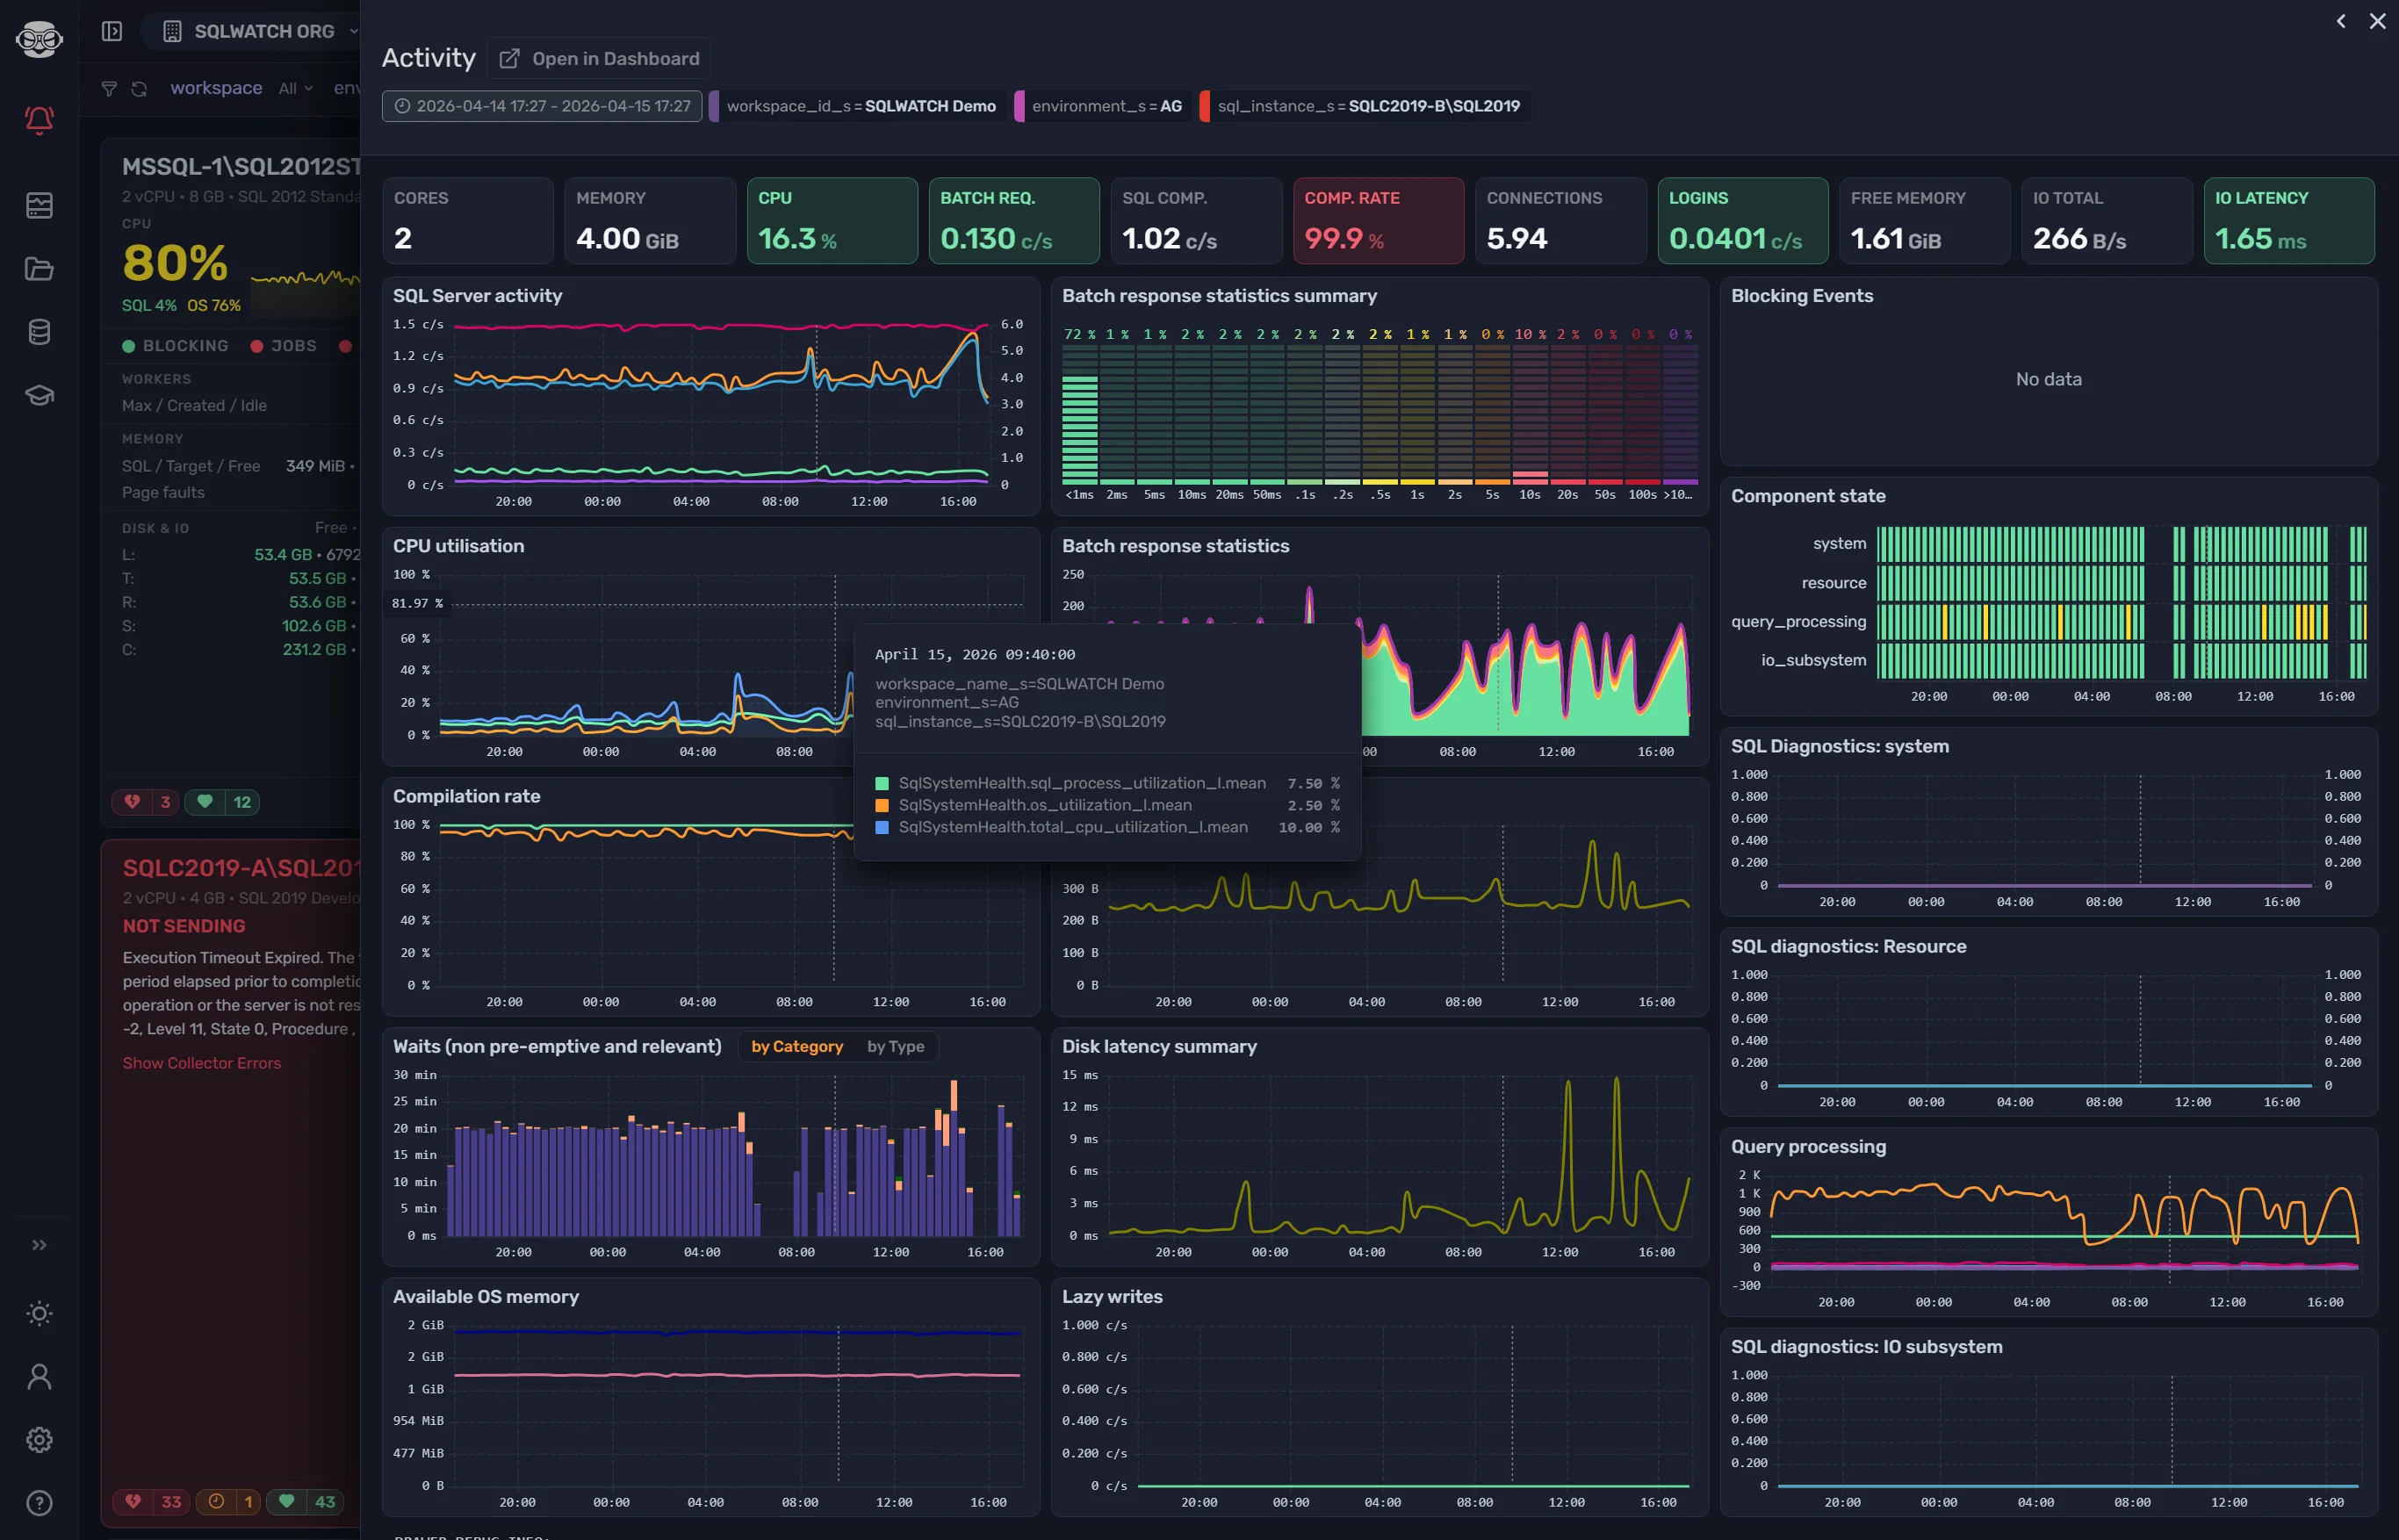
Query performance visibility
Instantly see which queries are burning CPU, causing I/O, or blocking others - with historical trends to catch regressions early.
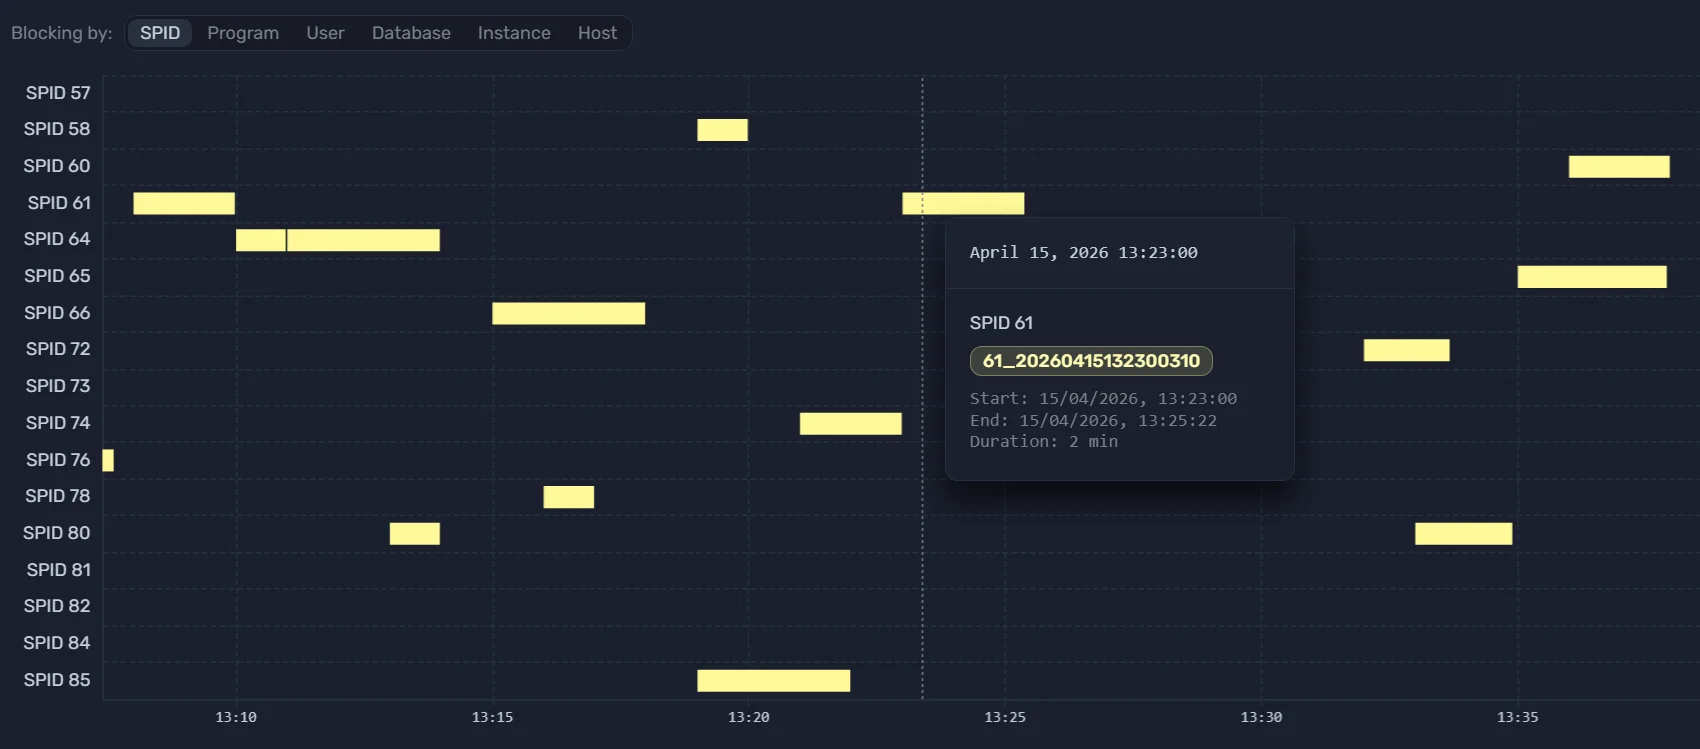
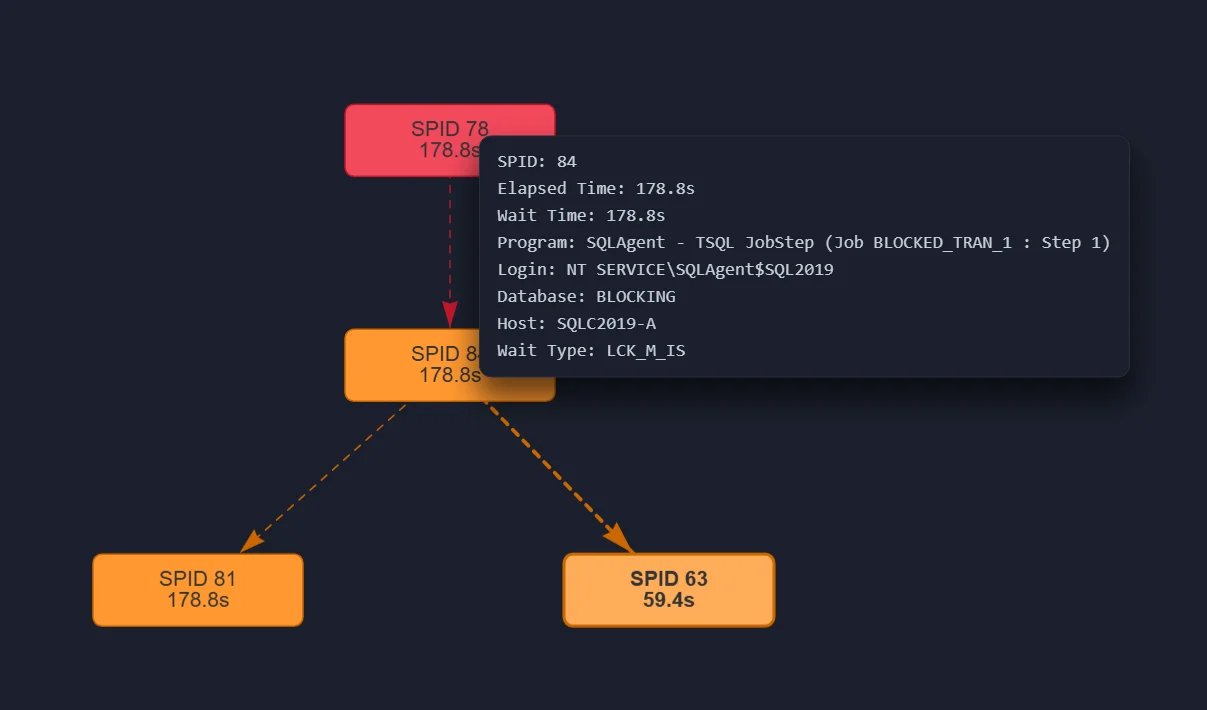
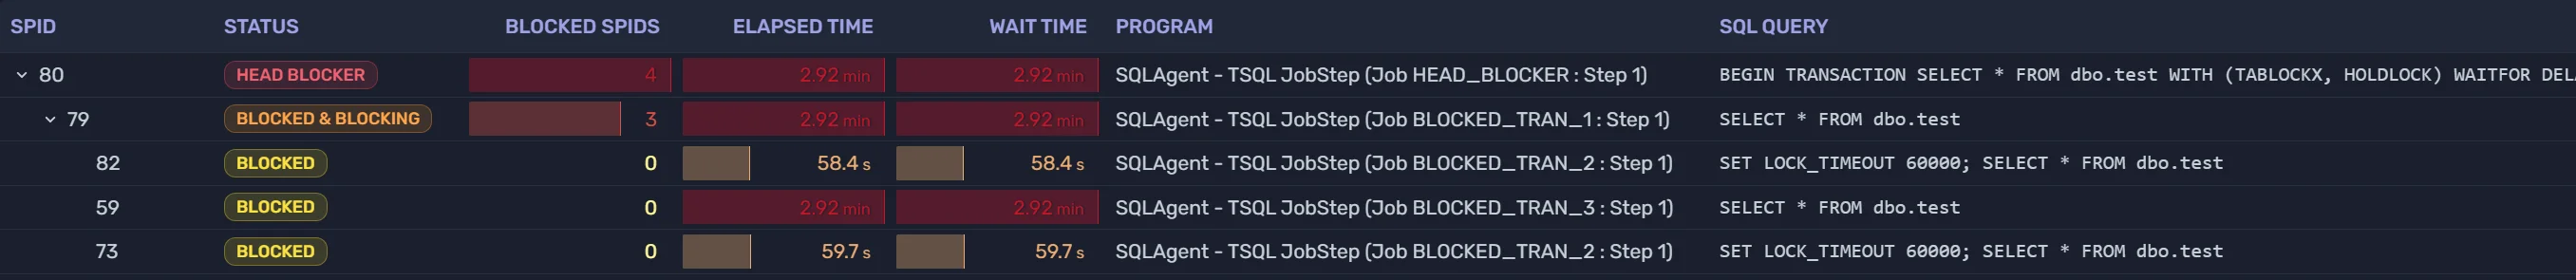
Blocking chain detection
Identify blocking sessions the moment they form. Drill down to the root blocker before users start calling.
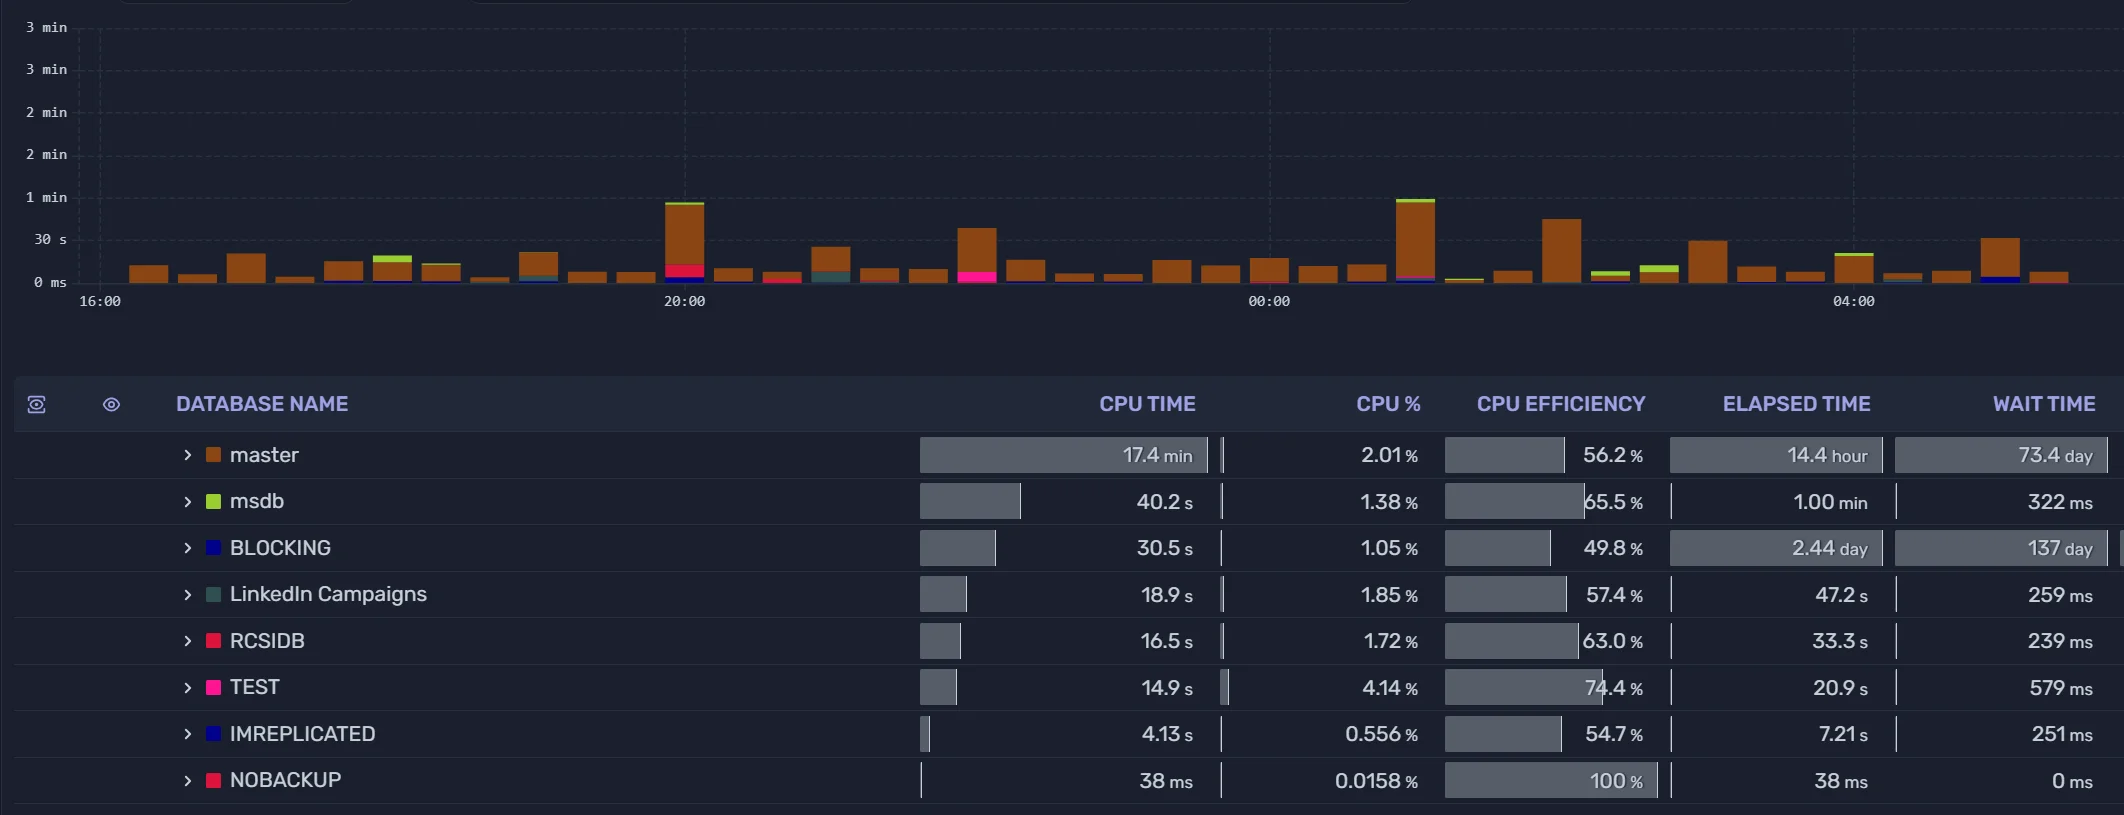
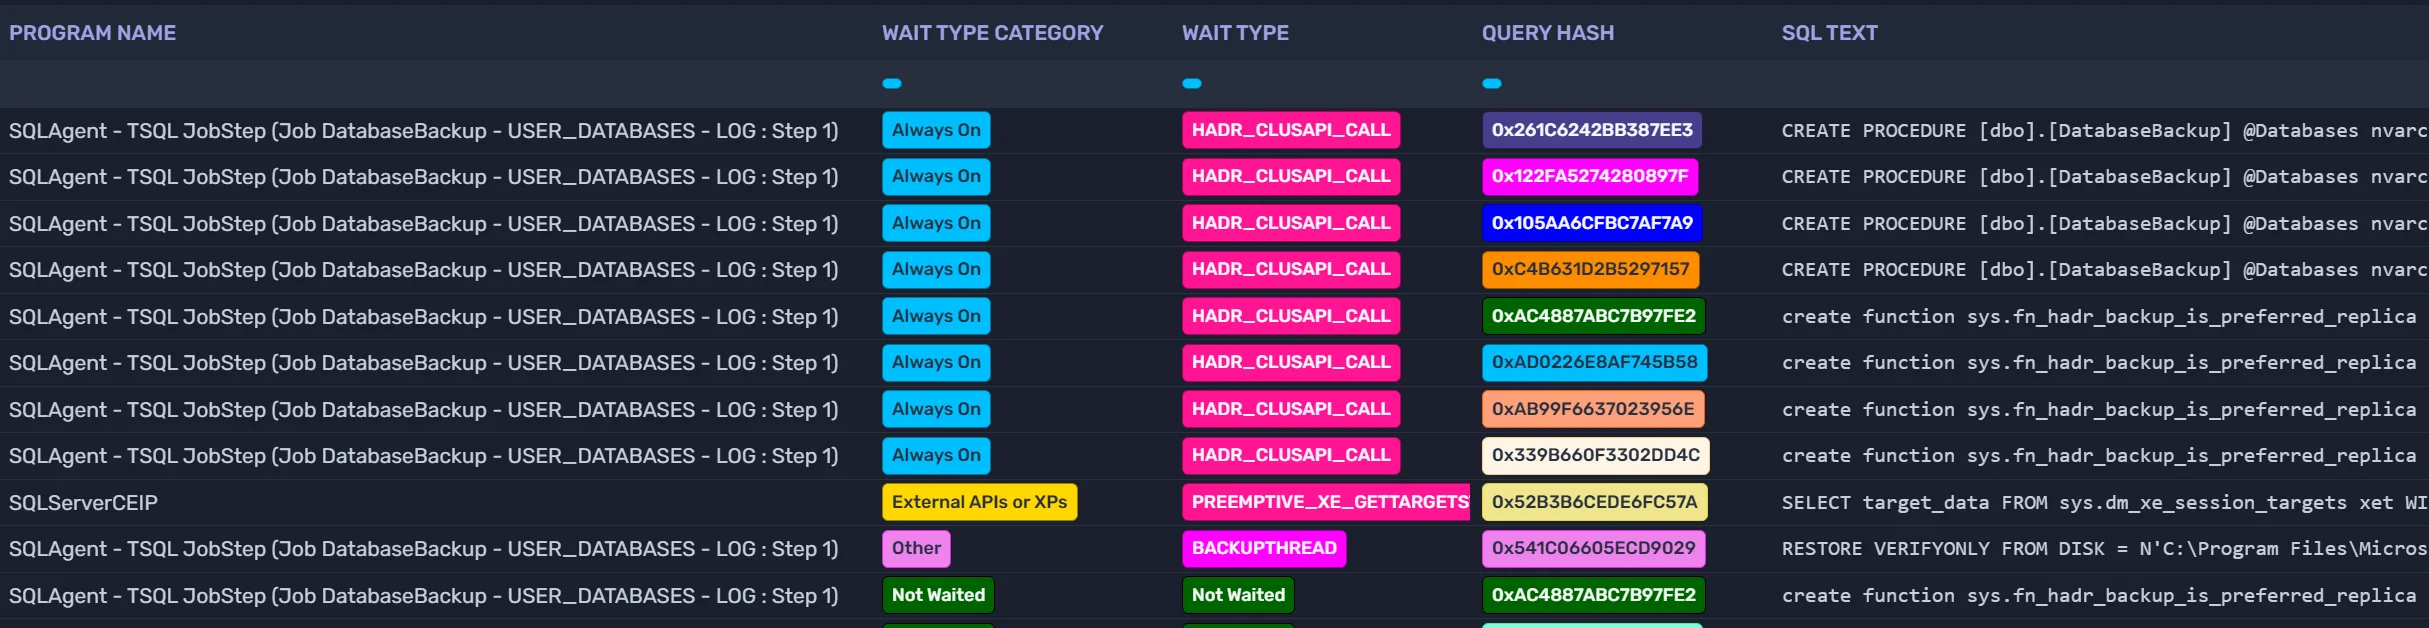
Wait statistics analysis
Know exactly what your server is waiting on. Correlate waits with workload patterns and resource pressure.
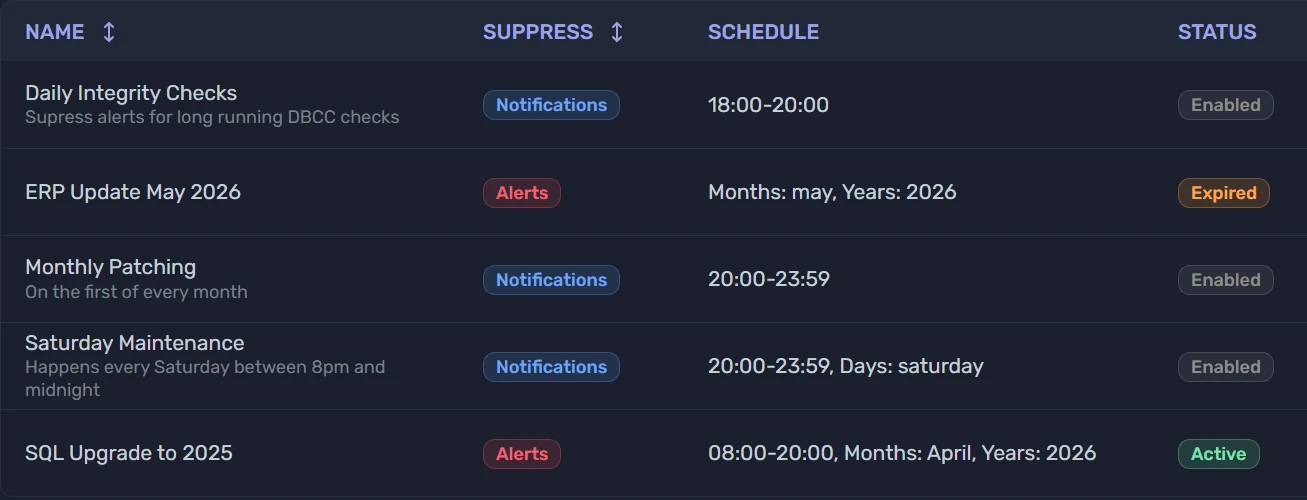
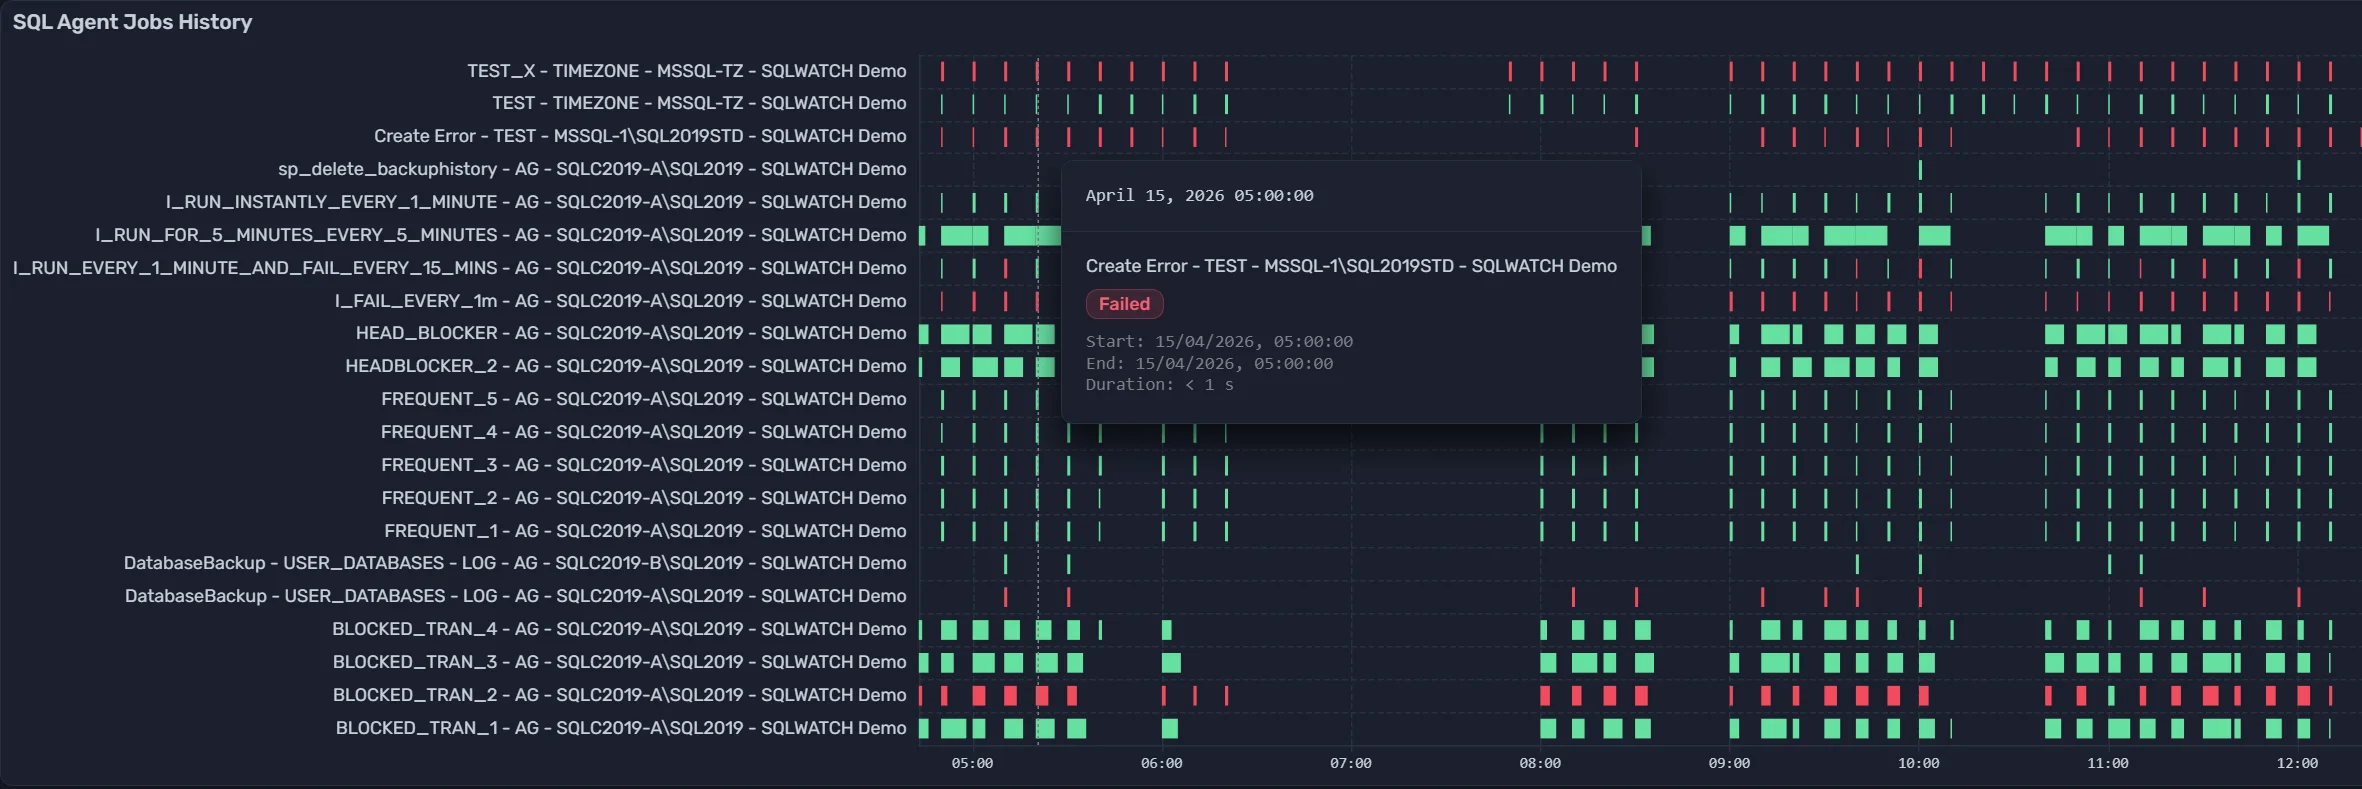
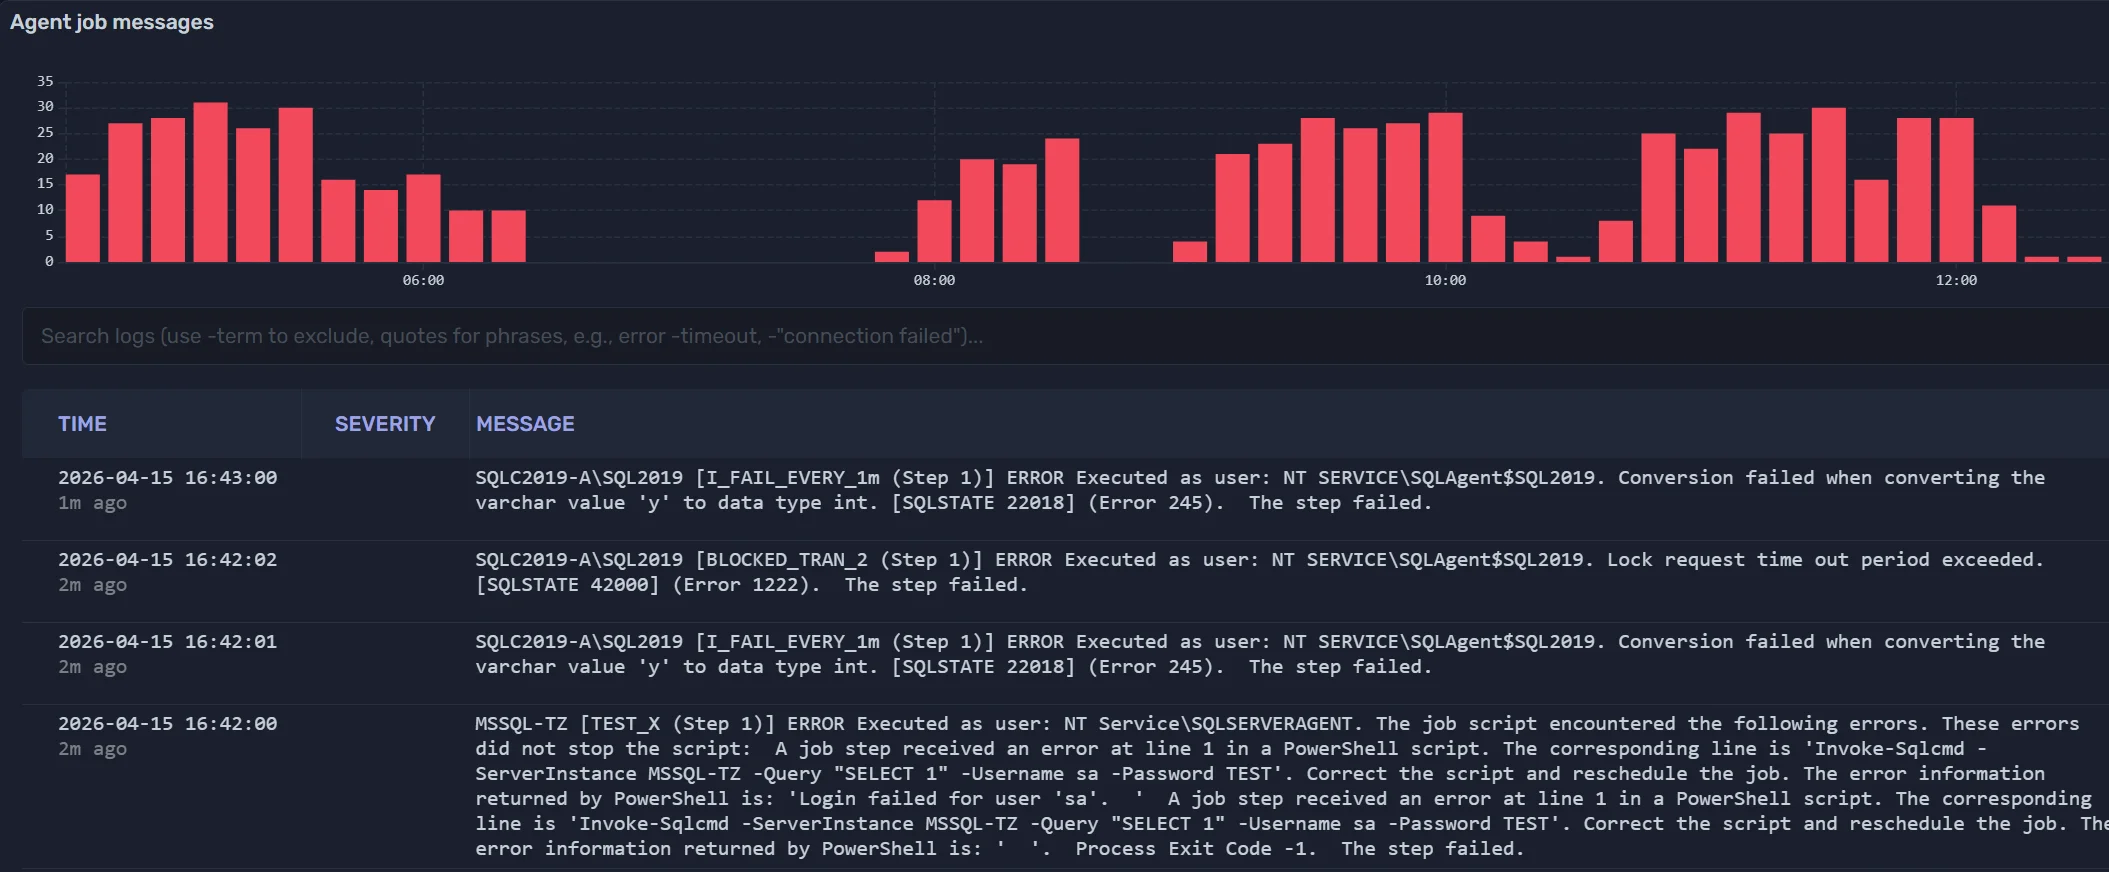
Agent job monitoring
Every SQL Agent job tracked - runtime, duration, success or failure - all in one view.
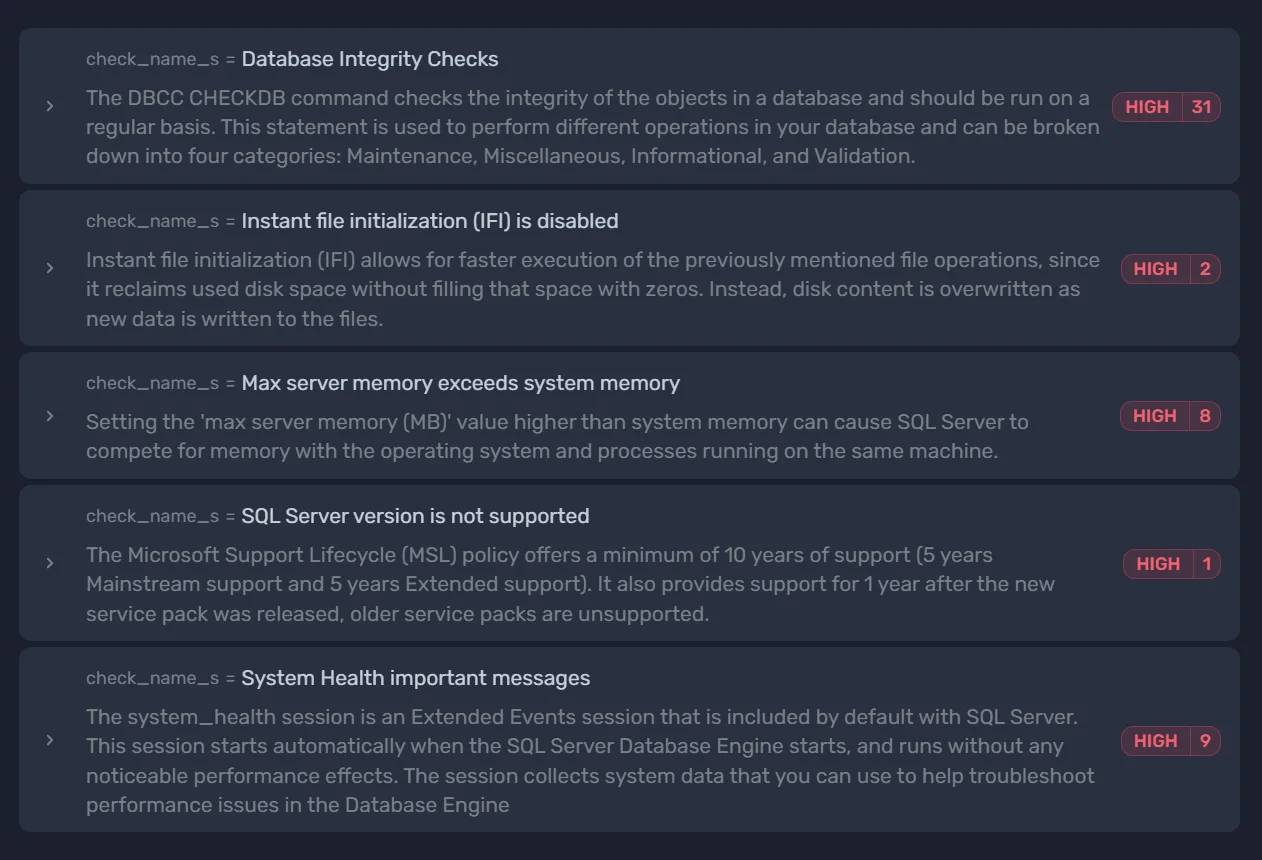
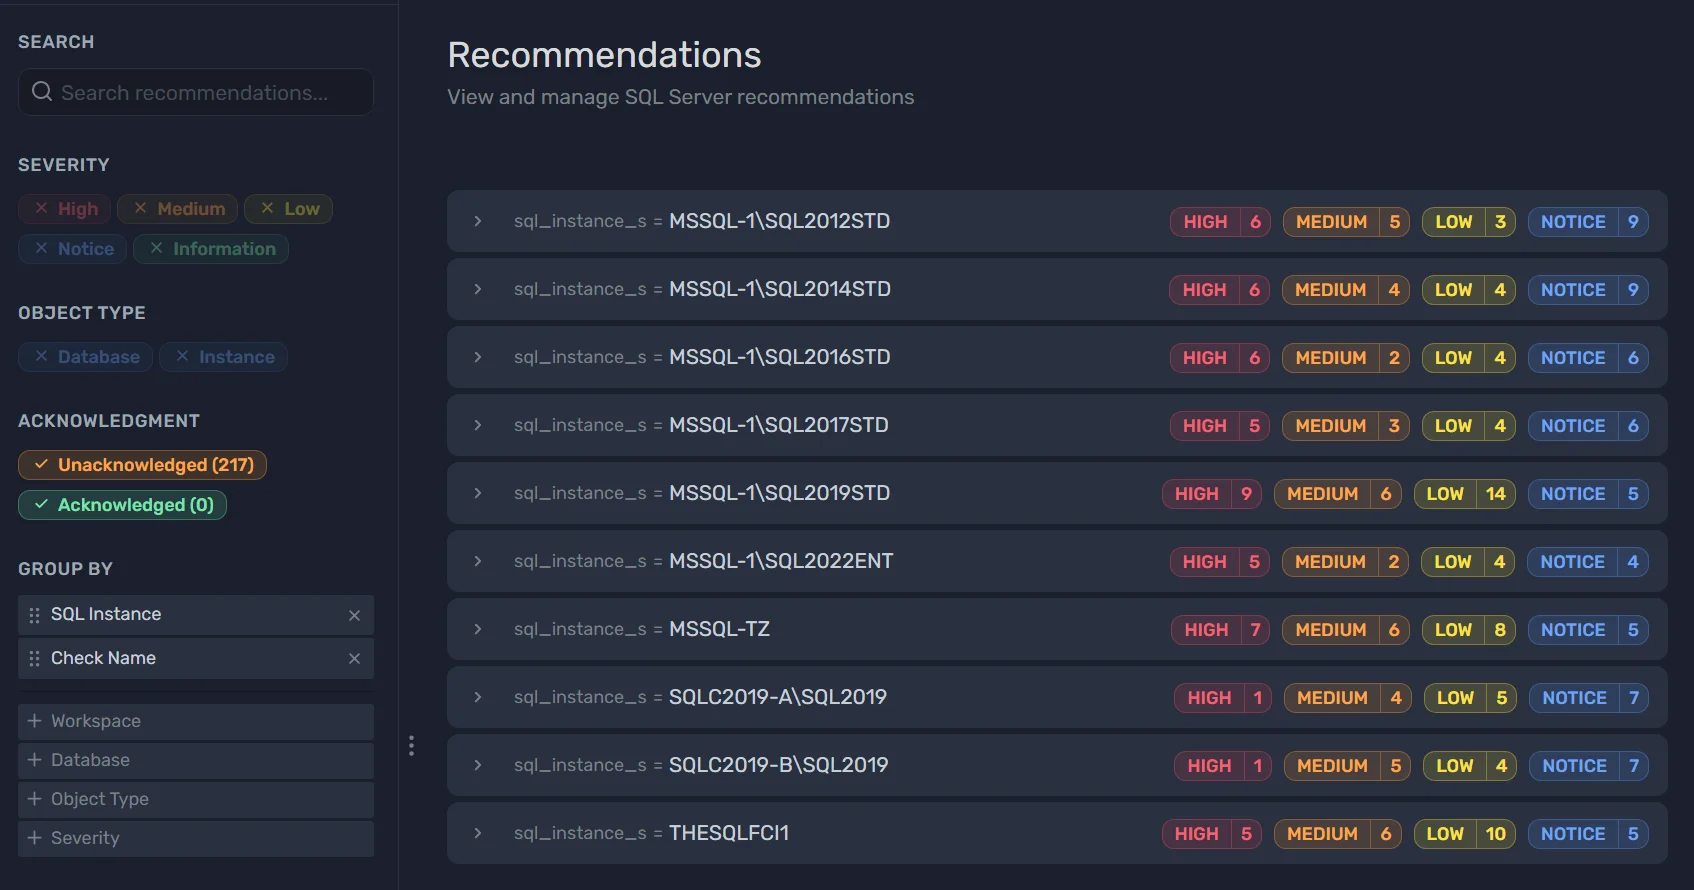
Configuration Recommendations
Healthcheck-based configuration analysis surfaces suboptimal settings and highlights areas where your SQL Server configuration could be improved.
Health checks and recommendations
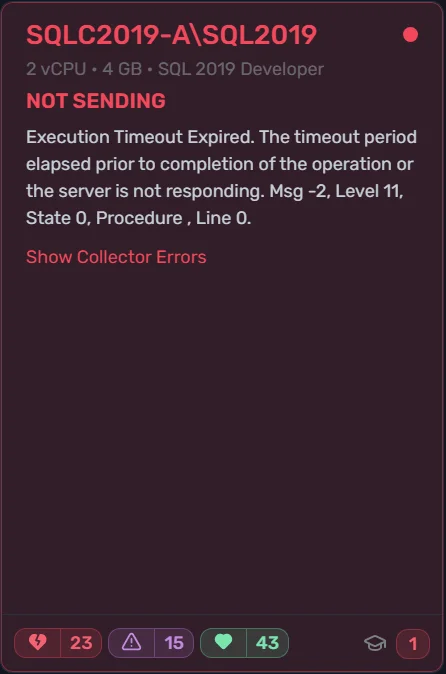
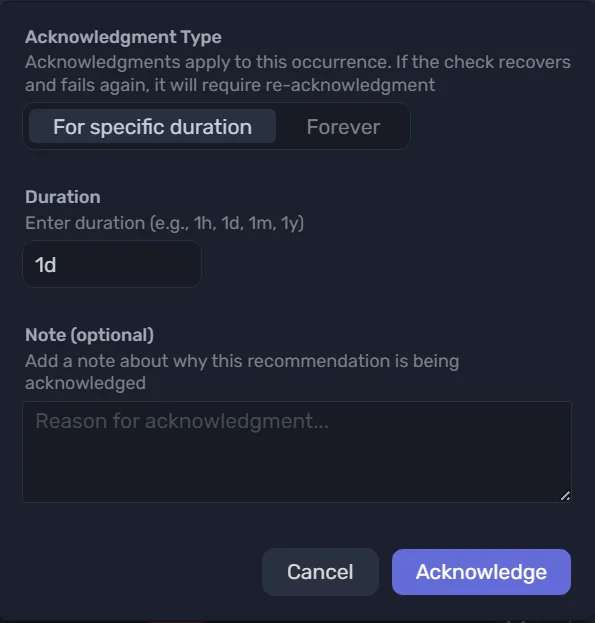
Automated best-practice checks with clear, actionable recommendations. Stay ahead of problems before they escalate.
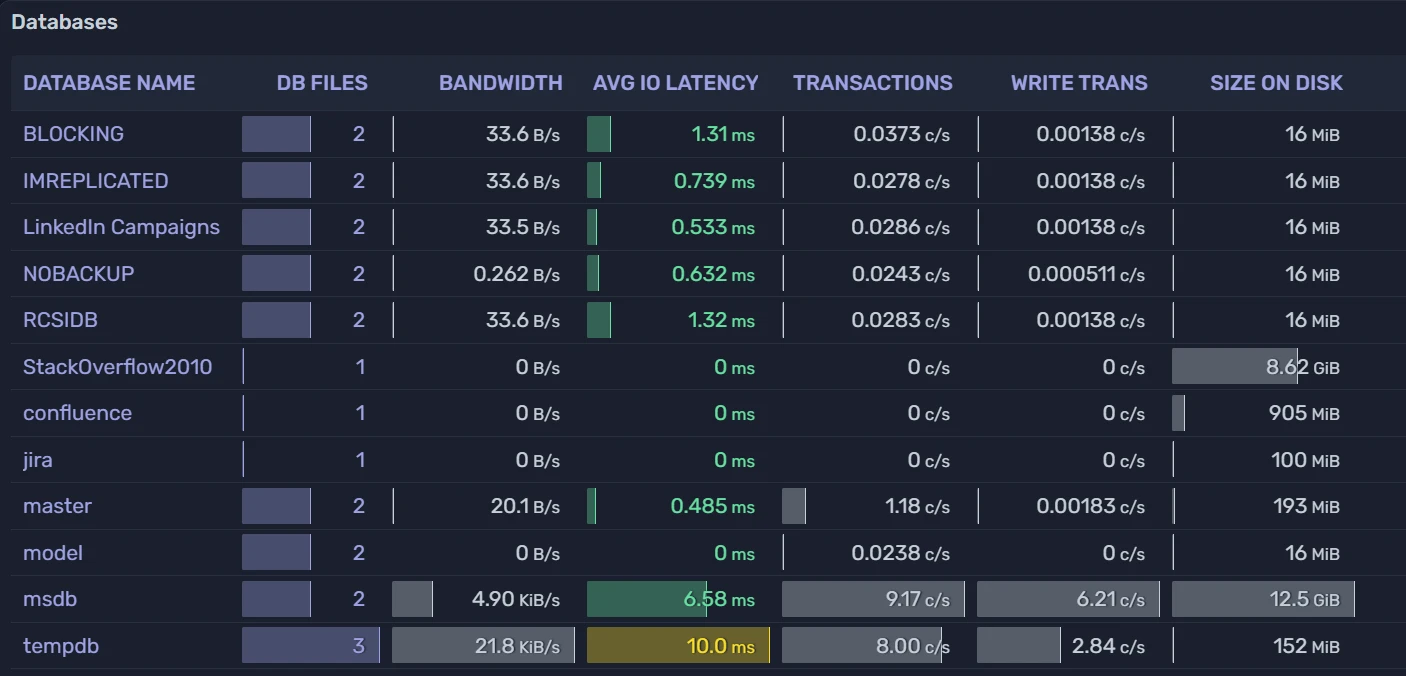
Data collection
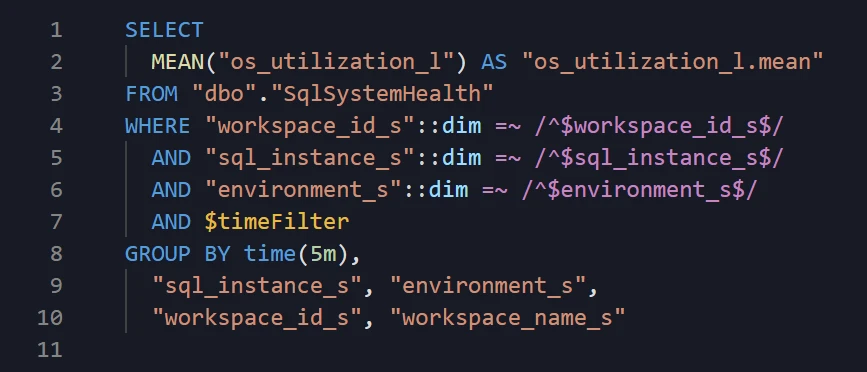
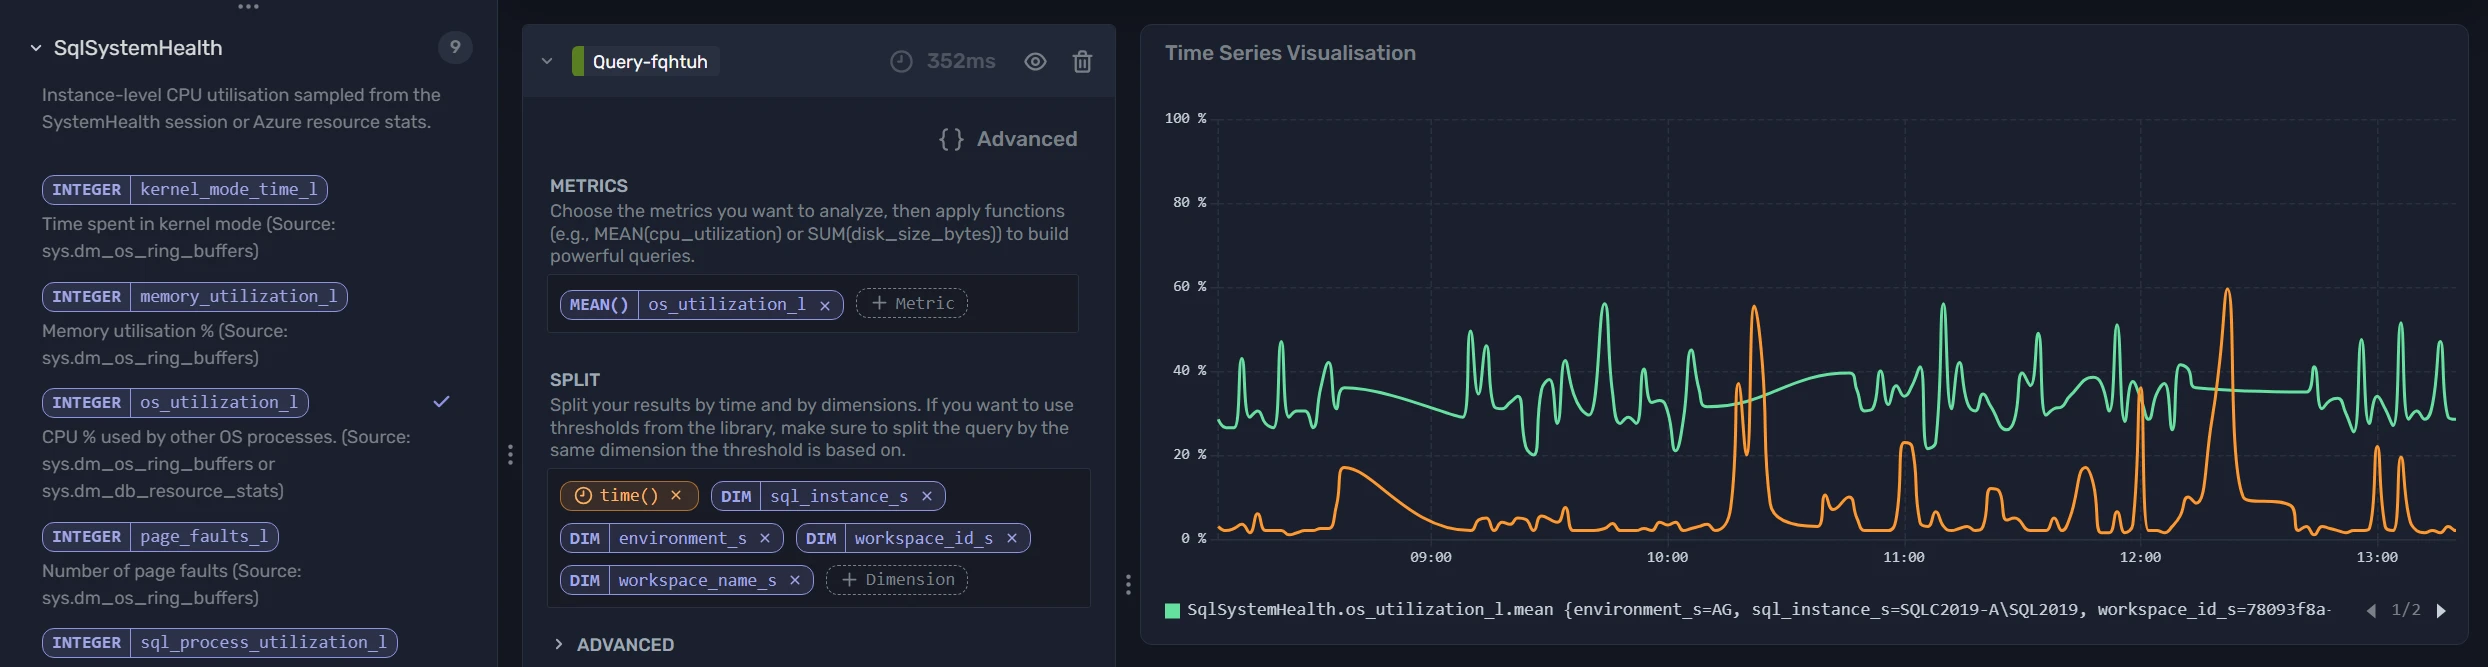
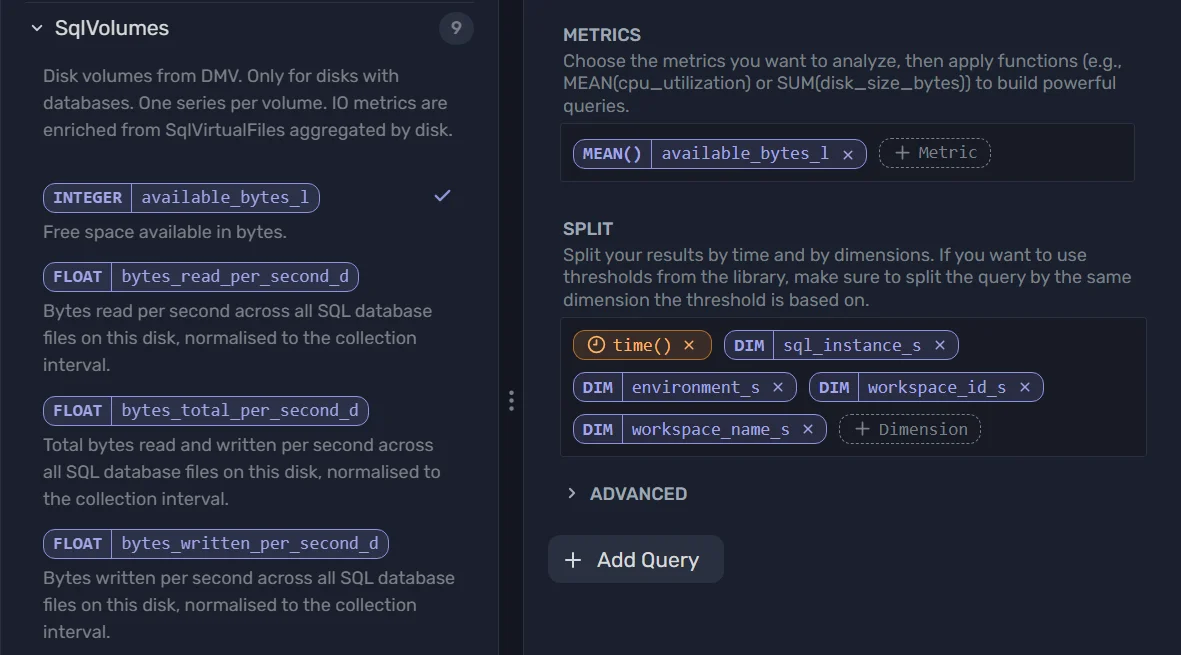
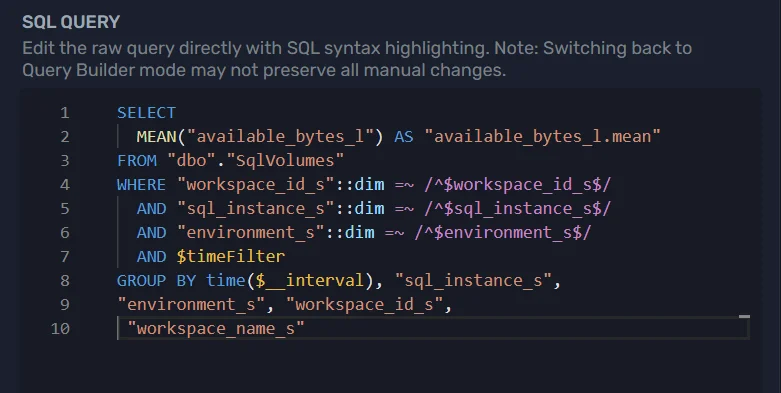
What does SQLWATCH Cloud actually collect?
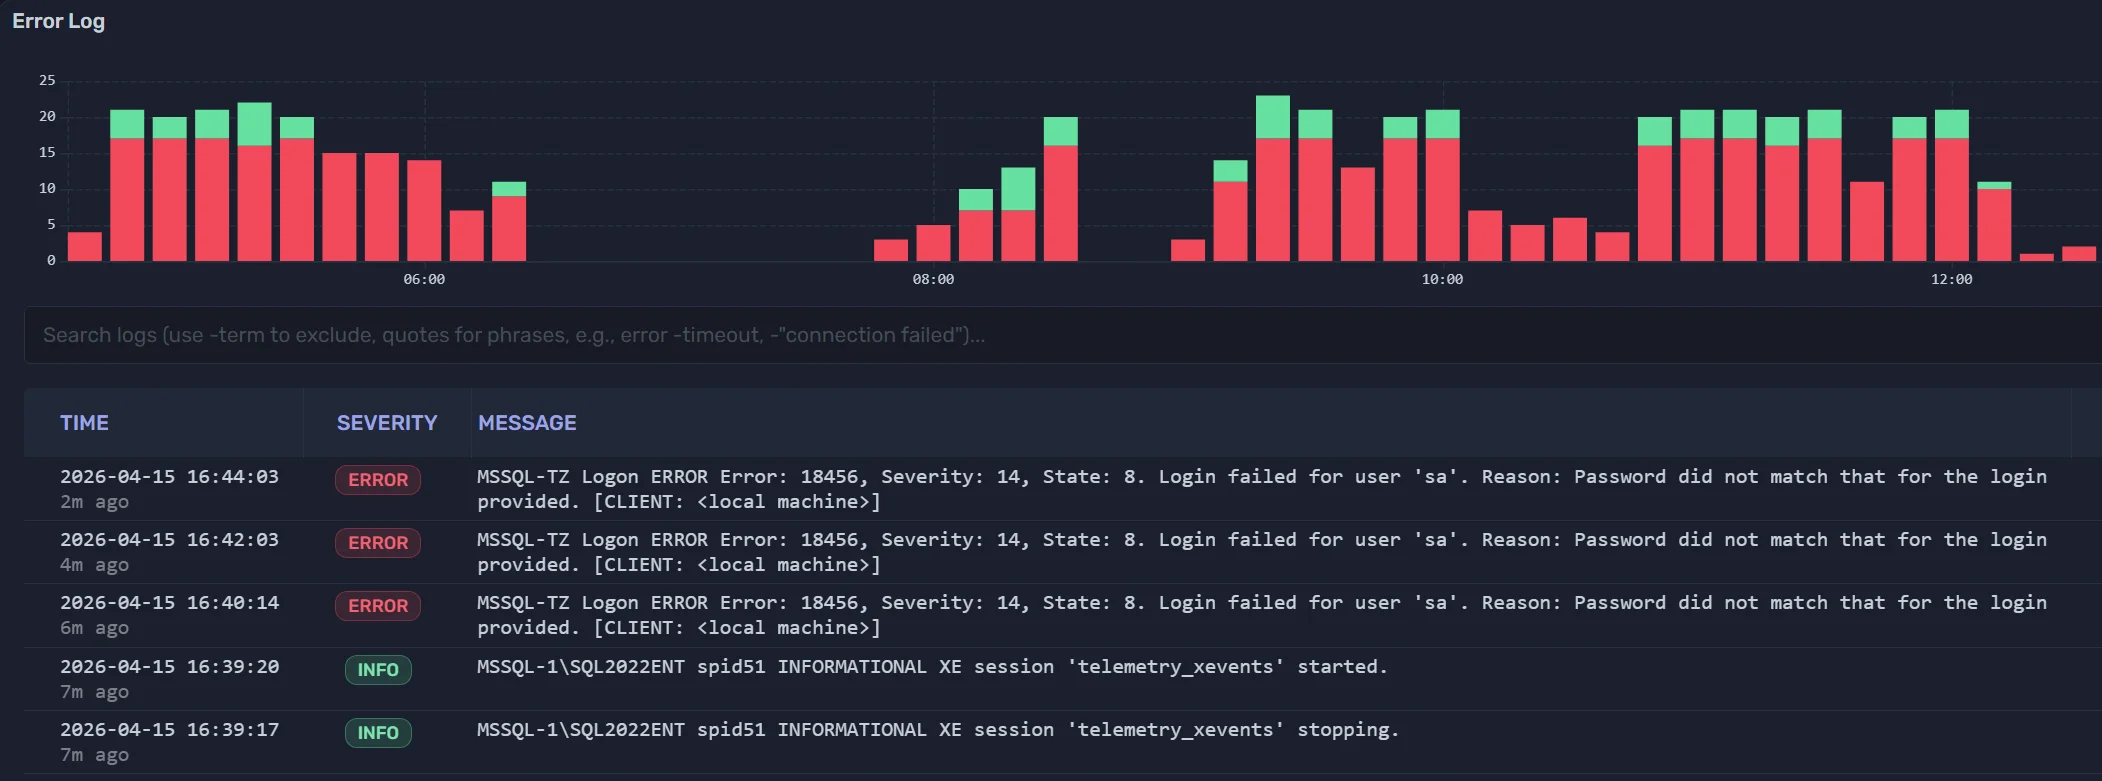
All data is sourced from SQL Server's own system views - Dynamic Management Views, system catalogues, Extended Events, and built-in monitoring surfaces. Examples include:
...and more. We never access or collect user data, table contents, or any personally identifiable information. Everything collected is system-level performance and health data - the same data a DBA would query manually.
Security
Single sign-on, included as standard
SSO is a security feature, not a luxury add-on. Every plan includes it at no extra cost - we do not believe in charging for the basics of keeping your team secure.
Microsoft Entra ID
Every customer can sign in via Microsoft Entra ID at no additional cost. Your users authenticate through Microsoft's identity platform - no separate SQLWATCH passwords to manage or rotate.
Email + MFA
For teams not on Entra ID, email and multi-factor authentication is available as standard. We authenticate via Okta - a SOC 2, ISO 27001, and FedRAMP-authorised identity provider. SQLWATCH never sees or stores passwords.
Bring your own identity (Enterprise)
Enterprise customers can register their own Entra ID application. SQLWATCH will authenticate users exclusively against your tenant - with your Conditional Access policies, in your sign-in logs, isolated from our provider.
Infrastructure certifications
SQLWATCH Cloud is hosted on Microsoft Azure infrastructure, which is certified for ISO 27001 and SOC 2 Type II. Our application and data handling practices implement controls aligned with those frameworks. We also conduct annual third-party penetration testing.
Ready to see MSP pricing?
Tailored quotes based on your instance count, retention requirements, and client access needs.