SQLWATCH Cloud v2.0: Monitoring That Finally Works The Way You Do

We have been quiet and busy in 2025, rebuilding SQLWATCH from the ground up. Not because we wanted to add features. Because monitoring tools keep forcing you into their workflow instead of yours.
The Problem We Solved
Every monitoring tool claims to be “flexible.” Then they lock you into rigid dashboards. Fixed hierarchies. Alert noise you can’t control. And if you’re an MSP? Forget about it-you’re clicking between 47 browser tabs just to see what’s on fire.
We got tired of it. So we fixed it.
What’s New in v2.0
Your Dashboards, Your Way
Build exactly what you need to see. Monitoring is personal-stop settling for someone else’s idea of “best practice.”
UI That Gets Out of Your Way
New, context aware left navigation panel. Instant flip between dashboards and servers. Drill down, drill up, navigate however makes sense to you. No forced hierarchies. Quickly compare current metrics with previous periods side-by-side.
Alerts That Actually Help
Route alerts where they need to go. Set maintenance windows. Get the actual error log in the alert-not a link you have to click. Multiple channels. Finally, alerts that give you what you need to fix the problem.
Ad Hoc Query Metrics
Not everything fits in a dashboard. Run your own queries, get your own metrics. No waiting for the next release to add “that one thing” and no need to build a new dashboard just to see ad-hoc metrics.
Snapshots Instead of Storage Sprawl
Keep the insights without unnecessary retention costs. The snapshots option enables you to capture what matters without keeping every data point forever.
Built for MSPs
See all your clients in one view. Single URL. Switch to the client workspace and work in their context. No more tab ping pong. No more “wait, which customer was this again?”
Filter the Noise
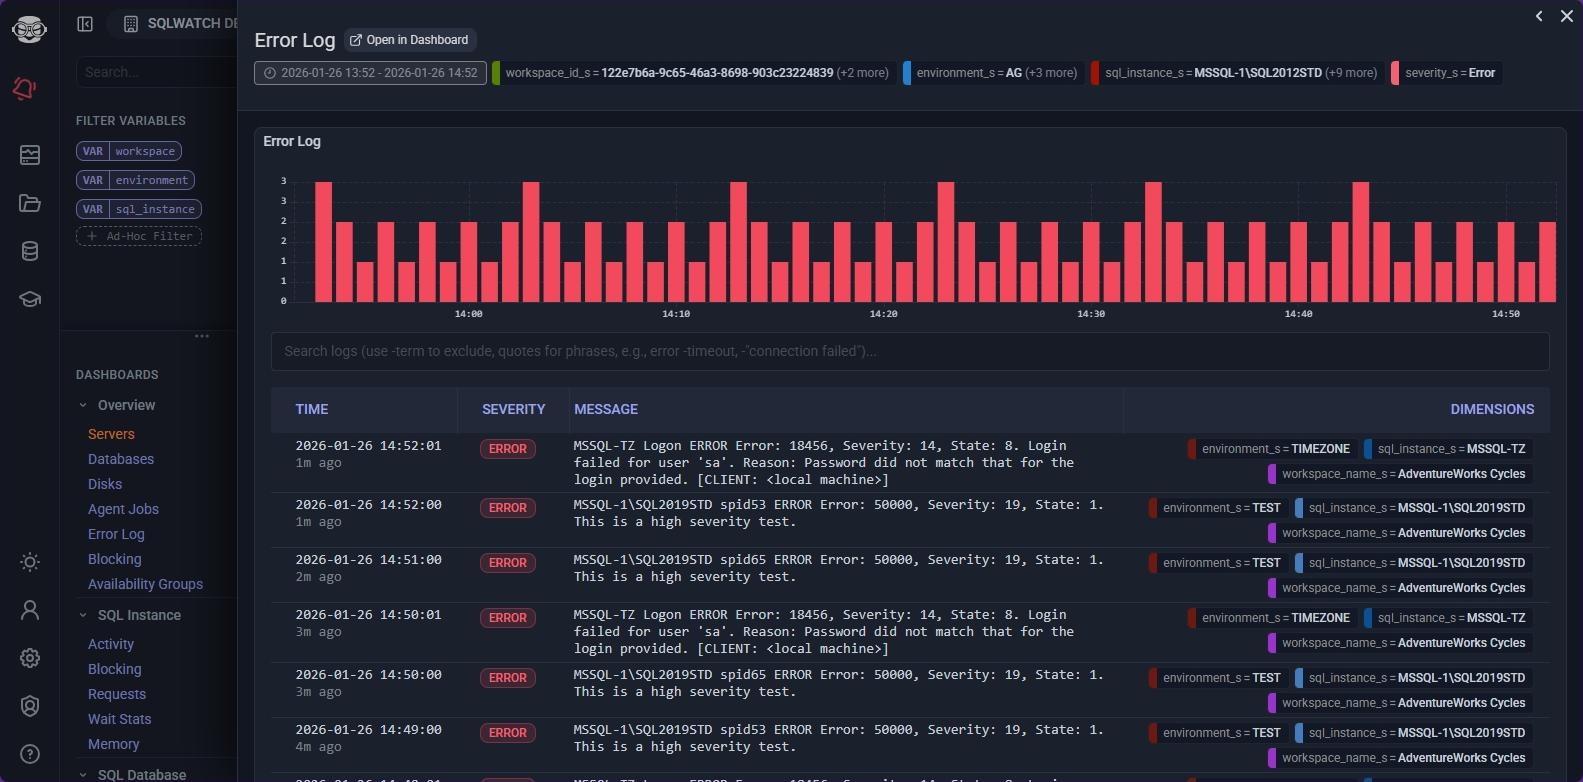
Error log exclusions let you silence the repetitive stuff that clutters your view. See the signal, not the noise.
Colour-Coded Clarity
Dimensions get consistent colour coding. Scan, recognise, act. Simple. Central place to manage thresholds.
Backend That Scales
Rebuilt infrastructure. Faster data collection. More reliable. More efficient. The stuff you don’t see but definitely feel.
Who This Is For
If you’re a DBA, DevOps engineer, or SRE tired of fighting your monitoring tool, v2.0 is for you.
If you’re an MSP juggling dozens of clients and drowning in context-switching, v2.0 is definitely for you.
The Bottom Line
Monitoring shouldn’t make your job harder. It should disappear into the background and surface problems when they matter.
SQLWATCH v2.0 does that.
